
 Home
Home News
News

- 1 The Ethereum 24-hour inflows are $33.79 Million, and the revenue of 24 hours is $9,06,323.
- 2 Volume To Market Cap ratio is 4.35%, highlighting weak liquidity.
- 3 The Ethereum blockchain has recently witnessed a notable resurgence in its TVL
Last month, Ethereum experienced a 11.04% decrease. Despite this fall, ETH exhibited a significant surge in its trading volume. However, its market capitalization saw a 5.27% drop within the last 24 hours.
CoinMarketcap highlights that the Ethereum’s market capitalization stood at $405.144 Billion, securing its standout position as the global second-largest crypto asset. This contributes to Ethereum’s robust presence in the global crypto market, with a market cap dominance of 18.1%.
Blockchain Analysis of Ethereum Crypto!
The Ethereum blockchain recently witnessed a notable resurgence in its TVL, that appeared to be signaling a renewed optimism in the sentiment of the ETH market.
Over the past several days, the TVL has climbed to an impressive $59.697 Billion, surpassing Bitcoin. This uptick is clear proof of the growing confidence among its investors regarding Ethereum’s potential and future market performance.
In correlation with the rise in TVL, the market capitalization of Ethereum’s stablecoins has also experienced a parallel increase. It also reflects the amount that are being staked within its ecosystem.
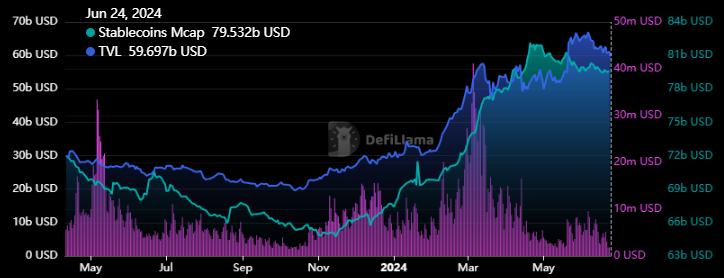
TVL | Source: Defillama
The advancement in TVL and the stablecoin market cap collectively paint a promising picture for Ethereum’s trajectory in the crypto market.
Ethereum (ETH) Crypto Technical Observation!
Ethereum (ETH) recently experienced a halt in its upward movement, having reached a high of $3,974. This period of consolidation came on the heels of an impressive 25% increase in its price value, which was triggered by a breakout from a descending triangle pattern on the daily chart. Despite a minor pullback from its peak, ETH is now nearing a significant resistance level at $3,780.
Should ETH manage to surpass and maintain above this resistance, it could probably indicate a bullish trend to resume, potentially leading to additional gains. Meanwhile, the technical indicators on the daily chart largely suggest a positive outlook. The 50-day EMA has provided support, that implied that the bullish momentum may continue.
Moreover, the ongoing golden crossover between the 50-day and 200-day EMAs is itself a strong signal of an optimistic long-term trend. Conversely, the MACD showed a bearish crossover, highlighting some caution to keep (DYOR).
The RSI having fallen below the 50 level and the 14-day SMA, that suggests a momentary weakening in momentum. For confirmation of a sustained uptrend, it would be prudent to observe the RSI’s recovery above the 50 mark.
Critical support levels for ETH are identified at $2,800 and $3,100, while resistance levels to consider are at $3,600 and $3,980. The interaction between these technical indicators and price points will be key in ascertaining the future direction of ETH.
Summary
Ethereum has seen an 11.04% decrease in price over the past month, with a 5.27% drop in market capitalization in the last 24 hours. Despite this, ETH maintains a market cap of $405.144 Billion, making it the second-largest crypto asset globally.
Furthermore, a surge in TVL and stablecoin market cap indicates growing investor confidence in Ethereum’s potential. Technical observations suggest a potential bullish trend if ETH surpasses resistance at $3,780.
Disclaimer
In this article, the views, and opinions stated by the author, or any people named are for informational purposes only, and they don’t establish the investment, financial, or any other advice. Trading or investing in cryptocurrency assets comes with a risk of financial loss.

Nancy J. Allen is a crypto enthusiast, with a major in macroeconomics and minor in business statistics. She believes that cryptocurrencies inspire people to be their own banks, and step aside from traditional monetary exchange systems. She is also intrigued by blockchain technology and its functioning. She frequently researches, and posts content on the top altcoins, their theoretical working principles and technical price predictions.


