
 Home
Home News
News
- 1 XRP crypto fell sharply after the breakdown of 200-Day EMA over the daily chart.
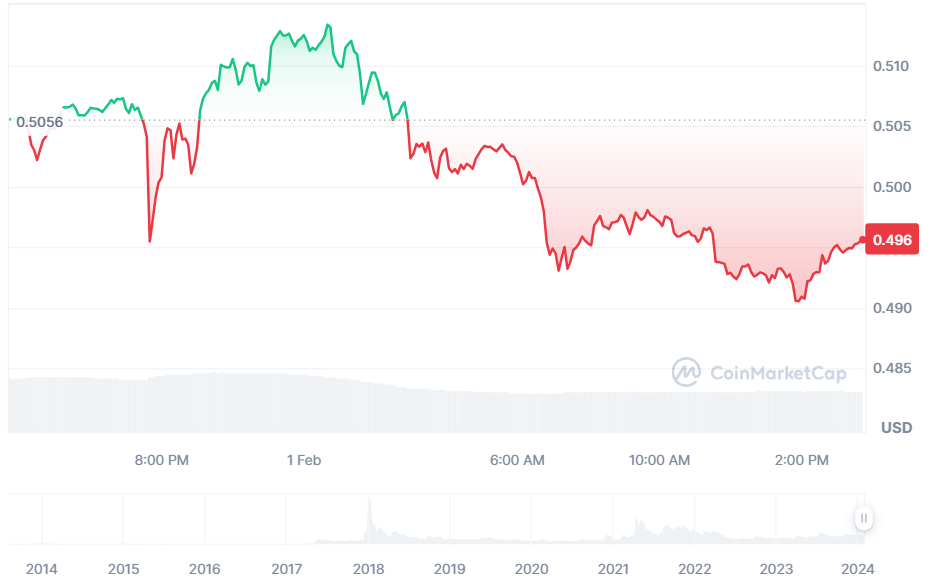
- 2 XRP crypto price was at $0.49, recording an intraday drop of 1.33% (press time).
XRP crypto stays under the modest bearish pressure for the third consecutive day and edged near the support zone and round level of $0.5. The crypto price is headed downwards after the breakdown below the 200-Day EMA.
Moreover, the buyers tried to hold the XRP price at the upper levels above the 200-Day EMA. However, they lost control after the breakdown of 200-Day EMA and a sharp fall was noted on the charts over the last two weeks.
The bulls tried on Monday and managed to post some gains but it was not enough. The sellers took it as a discounted price and made heavy short positions due to which the price kept on losing for the last three sessions and has reached the key support zone of $0.5.
At the time of writing, the XRP cryptocurrency was at $0.49 with an intraday loss of 1.33%. Also, it has a market capitalization of nearly $26.96 Billion after the intarday loss. The volume to market cap ratio is 5.06% suggesting low volatility in the crypto.
XRP Price Trend Analysis
The Analysis of the XRP/USD crypto chart over the daily time frame shows that XRP crypto maintained a positive outlook from mid-October to November. The price attained a high of $0.75 in the 1st week of November, rising from a low of $0.48 in mid-October.
Since then, the crypto has been in a correction phase and could not break above the high. The XRP crypto consolidated above the 200-Day EMA for almost two months and broke below it suggesting a short-term bearish outlook.
Currently, the price is near the previous demand zone from where buyers might try to turn the table in their favor. However, the buyers need to surpass multiple supply zones to reclaim the bullish territory.
Now, if the price breaks below the recent support it may drop sharply to test the lower support levels of $0.45 and $0.4.
At the time of writing, RSI was at 31.08 points and that of SMA line was at 35.18 points. Both the lines were hovering below the mean line suggesting a bearish outlook in the short term.
XRP Price Prediction February 2024

The bearish outlook of the analysts shows that the price has more room to decline if it breaks below the $0.5 level and might drop to a low of 0.43 by the month end. The positive view of the analysts hopes that the price could retest the 200-Day EMA on the daily chart.
XRP Price Prediction 2024
The price forecast for the year 2024 highlights that the XRP token price could reach a high of $0.750, suggesting a potential gain of over 52.08%. Moreover, the bearish outlook of the analysts hopes the price could reach $0.643 by the year-end.
XRP Price Prediction 2025
By the year 2025, the XRP price may attain $1.046 as the highest price. On the flip side, the minimum price up to which the crypto price may rise by the year 2025 is $0.871.
Disclaimer
The views and opinions stated by the author, or any people named in this article, are for informational purposes only and do not establish financial, investment, or other advice. Investing in or trading crypto or stock comes with a risk of financial loss.

Amanda Shinoy is one of the few women in the space invested knee-deep in crypto. An advocate for increasing the presence of women in crypto, she is known for her accurate technical analysis and price prediction of cryptocurrencies. Readers are often waiting for her opinion about the next rally. She is a finance expert with an MBA in finance. Quitting a corporate job at a leading financial institution, she now engages herself full-time into financial education for the general public.


