
 Home
Home News
News
- 1 CAT stock price is trading below the key moving averages showcasing bearishness on the daily charts.
- 2 The Caterpillar Inc. earnings report will be released on Monday, October 31, 2023.
Caterpillar CAT will release its third-quarter earnings report on October 31st, Tuesday. It is estimated that Caterpillar will deliver a profit of $4.75 per share which is 20.25% growth versus the same quarter last year.
The earnings report is expected to strongly influence price movement. If the earning numbers are better than expectations, then the stock price will surge sharply. But, if the company misses the expectations, then the CAT stock price might see new lows.
Caterpillar Inc. is involved in the manufacturing and selling of mining and construction equipment including off-highway diesel and natural gas engines, industrial gas turbines, and diesel-electric locomotives.
CAT stock looks attractive at the moment. As per simplywall.st, it is trading below the estimated fair value and the earnings are predicted to grow 5.8% per year. Moreover, earnings have grown by 9.5% over the past 5 years and the company also pays a dividend of 2.15%.
At the time of writing, Cat stock’s trading volume was 4.478 Million and the average 10 days volume is 3.293 Million with a market cap of 123.526 Billion. The stock has a dividend yield of 2.15%. Moreover, the CAT has a basic EPS of 16.16 and the price to earning ratio of 14.84. The current share float of 509.395 Million.
Reading the CAT Stock Price Charts
Caterpillar stock price is facing strong bearish pressure on the daily technical charts. It is trading below the 100 and 200-day EMAs. The stock failed to break above its key resistance levels in the past few months, despite several attempts by the buyers.
The stock is currently trading near $242.16, with a marginal gain of 1.51% in the intraday session. The stock has a potential upside target of $270, but it needs to overcome the bearish momentum and surge above the 200-day EMA. The stock has a support level of $238, which could prevent further fall.
Caterpillar’s price prediction suggests that the stock is in the firm grip of the bears. The technical indicators favor the bears projecting a pessimistic perspective for the buyers. RSI and stochastic RSI oscillators are moving near the overbought zone whereas the major EMA lines are acting as barrier points for CAT price.
Returns were 0.61% in the year-to-date period, a positive return of 12.30% in the last six months, a negative return of 12.60% in the last month, and a 2.21% return last week. This shows a persistent bearish trend that has not reversed yet.
Indicators Evaluation of CAT Stock Price
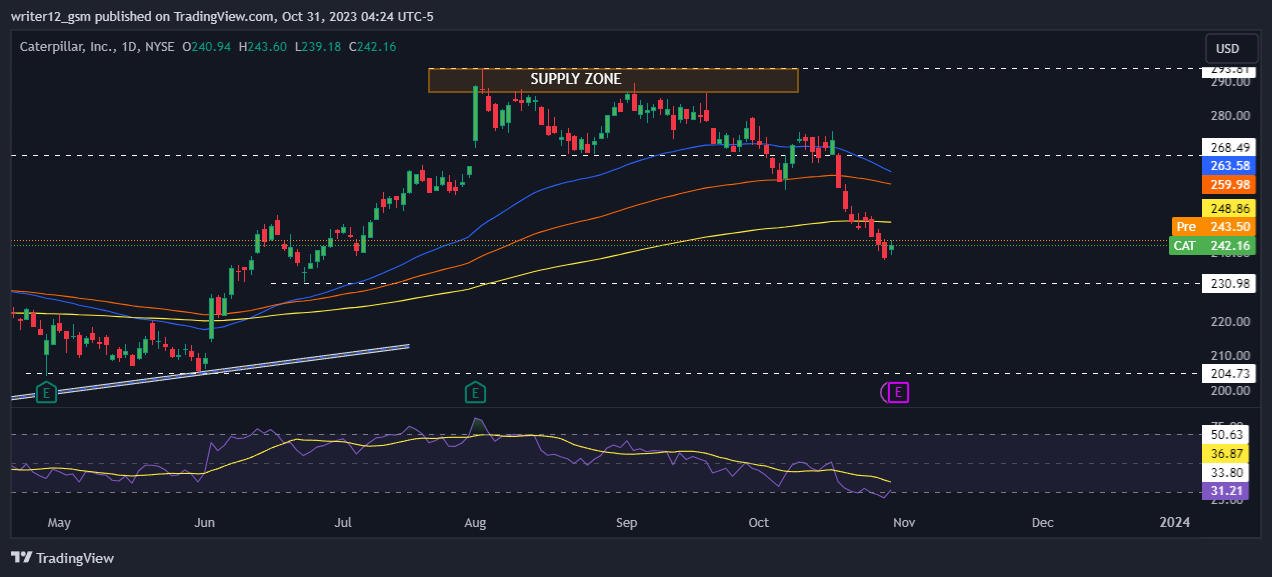
Caterpillar stock (NYSE: CAT) is trading under the 50 and 200-day daily moving averages (DMAs), which are not upholding the price trend. The current value of RSI is 31.21 points. The 14 SMA is below the median line at 36.87 points which indicates that the Caterpillar stock is bearish.
The MACD line at -8.36 and the signal line at -6.13 are below the zero line. A bearish crossover is observed in the MACD indicator which signals more bearishness for the CAT stock price.
Short-Time Horizon Analysis
CAT stock has shown sellers’ strength, and profit booking in the stock was noted on the short-term charts. Moreover, the price is below the key EMAs, which shows further weakness in the stock. The RSI curve is near the oversold region at 32, and a negative outlook was noted, indicating bearishness in the stock. The MACD shows red bars.
Weekly-Time Horizon Analysis
The weekly chart shows selling pressure. The stock has been on a downward trend, as it has broken below the 50 EMA. The technical indicators also confirm the bearish sentiment, as the RSI is near the oversold zone at 43 and the MACD has formed red bars and a bearish crossover. These signals indicate that the stock may face more downside pressure in the coming weeks.
Summary
Caterpillar (NYSE: CAT) technical oscillators support the bearish trend. The MACD, RSI, and EMAs are emphasizing negative signs and imply that the downtrend may continue in the CAT stock price. Caterpillar’s price action suggests that the investors and traders are bearish on the 1-day time frame. The price action reflects a bearish perspective at the moment.
Technical Levels
Support Levels: $228.34 and $204.47
Resistance Levels: $244.29 and $268.49
Disclaimer
This article is for informational purposes only and does not provide any financial, investment, or other advice. The author or any people mentioned in this article are not responsible for any financial loss that may occur from investing in or trading. Please do your own research before making any financial decisions.
Steve Anderson is an Australian crypto enthusiast. He is a specialist in management and trading for over 5 years. Steve has worked as a crypto trader, he loves learning about decentralisation, understanding the true potential of the blockchain.


